How many rox (Holo) Antwerp 2022 stickers exist?
How many are left? When does the supply run out?
The Roxetta Stone
The definitive count of rox (Holo) sticker supply in CS2.
Published May 25, 2026Living document, updated as new data lands
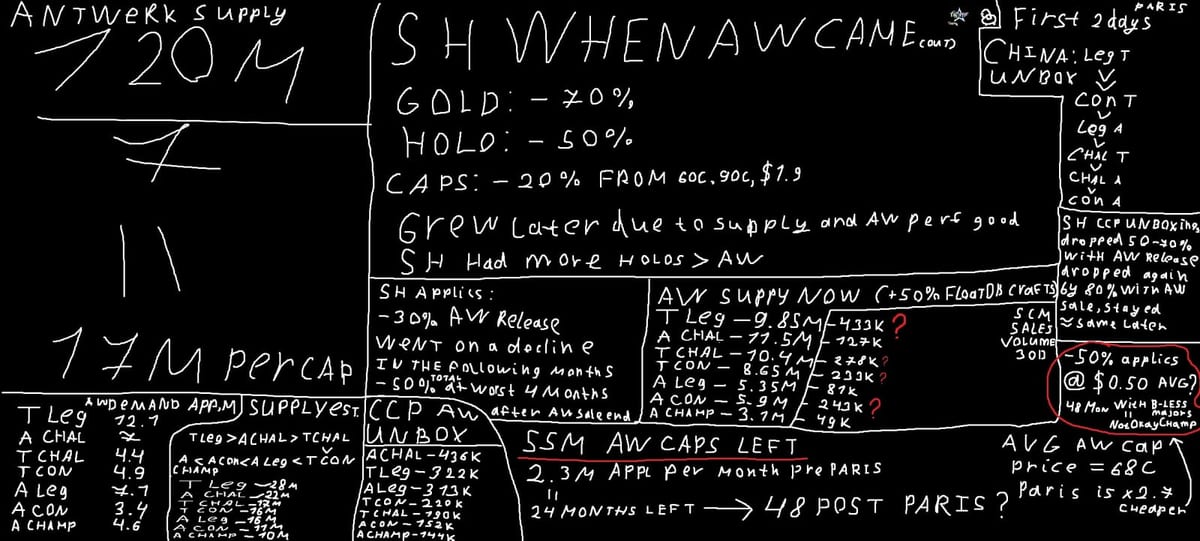
Click to zoomThe Roxetta Stone in its original glory. Surfaced years ago in the CSMarket Forum Discord and has been quietly powering supply estimates ever since.
A while back, deep in the CSMarket Forum Discord, this chalkboard appeared out of nowhere. No one really remembers who posted it first. The spelling is creative, the capitalisation is going through a phase, and the English is doing its best, but the numbers themselves are not jokes. Most of them still hold up against what we can measure today.
So I started calling it the Roxetta Stone, half as a joke that stuck. The original Rosetta Stone gave classicists three parallel inscriptions of the same text in three writing systems, which is what cracked Egyptian hieroglyphics open. This little chalkboard does something similar for the CS sticker economy. It puts the numbers from three Majors side by side: Stockholm, Antwerp, and a few Paris reference points to anchor the scale. Once you read it carefully, the question of how many rox (Holo) stickers can ever exist almost answers itself.
What follows is not a guided tour of the photo. It is the same question the chalkboard tries to answer, rebuilt from the ground up. Each section walks through one of the math steps that lead to the rox (Holo) ceiling, with the live numbers we still pull every hour from CSFloat DB. By the end you should have a precise answer to the question that started this whole project: how many rox holos can ever exist, how many already do, and how much of the original capsule supply is still out there.
Decode the Stone
Seven sections to break down everything we know about Antwerp 2022 capsule supply. Click any panel to expand it. Open as many as you like.
Valve has never published the number of capsules they sold for any Major. They have, however, dropped one figure in passing, and that one figure is enough to put a hard ceiling on everything else.
In August 2022, in a blog post celebrating the 10th anniversary of Counter-Strike: Global Offensive, Valve mentioned that participating teams and players had received over $70 million from sticker sales over the previous year. That window covers the two Majors of the period:
PGL Major Stockholm 2021 (October-November 2021)
PGL Major Antwerp 2022 (May 2022)
That is the only first-party revenue figure Valve has ever shared for these two Majors. Every estimate on this page is anchored against it.
Counter-Strike blog, August 2022. The single sentence that anchors the entire model.
The Headline
$70m+
to teams and players
Combined revenue from Stockholm 2021 + Antwerp 2022, disclosed by Valve in the official Counter-Strike blog, August 2022.
From Teams' Cut to Total Sales
Major-sticker revenue is split 50/50 between Valve and the participating teams. That arrangement has been Valve's standing policy since 2014 and has never changed. Every team capsule listing on the Steam Market spells it out: "50% of the proceeds from the sale of this capsule support the included organizations".
So if teams collected over $70m, Valve collected the same. The total gross sales for the Stockholm + Antwerp window comes to:
Teams & players$70m
Valve$70m
Total gross sales$140m
That $140 million budget is the starting point for every other number on this page. The capsule supply, the souvenir split, the per-capsule breakdown, the rox (Holo) ceiling: each of them has to fit inside the $140m. None of them can be solved from $140m alone, but every one of them has to be consistent with it.
Why This One Number Helps So Much
It does not give us every other number on its own, but it puts a hard ceiling on what the rest can be. Once we know the total amount of money players spent across both Majors, we also know the maximum number of capsules and souvenirs that could have been produced and sold. Multiply average prices by quantities and the total has to land at $140m. Not a dollar more. Move any single variable too far in either direction and the math breaks. The other inputs (price ranges, share splits, scrape data) still do real work, but $140m is the budget they all have to fit inside.
The next section does exactly that: it splits the $140m into capsules, souvenirs, and the Stockholm versus Antwerp shares.
Source
Valve, "10 Years of CS:GO" blog post, August 2022. The original page at blog.counter-strike.net has since been removed by Valve, but you can read the archived version through the Wayback Machine. The same week, the figure was independently quoted by Dexerto, Esports Insider and Escorenews, all of which still link the same $70m team-payout figure.
Not all of that $140m became capsules. Several products shipped at every Major and shared the same revenue:
Sticker capsules: team capsules and autograph capsules, all released at $0.99 and dropped to $0.25 on later sales, plus a Champions capsule released after the final.
Souvenir packages: match drops or direct-purchase packages (~$3 each via Viewer Pass tokens) containing weapon skins from the Major's active map pool.
Viewer Pass and patch packs: a small but real slice on top, around $5m combined for SH and AW. The Pass unlocks the Pick'em challenge, souvenir token drops, and a few patches for sale.
Splitting those is the first thing we have to do.
Step 1 · Souvenirs vs Capsules
The souvenir side is the trickiest part of the model, but the count is more solid than it looks. Each souvenir package on Steam carries the name of the major it came from. Stockholm 2021 Mirage souvenirs are tagged "Stockholm 2021 Mirage Souvenir Package", and so on. The skin that drops keeps that link via the gold sticker on top, plus a hidden tournament tag that does not vanish even if the gold sticker is later scraped off.
So in 2022 and 2023, when Stockholm and Antwerp were the only majors that ever shipped these specific Riptide-era souvenir collections, you could query CSFloat DB for the souvenir versions of those skins and get the full SH+AW total at once. The number landed at around 13 million packages opened, including the ones with scraped-off gold stickers.
Today the same query is murkier because later majors reused the same Riptide collections inside their own souvenirs, so a "souvenir Mirage skin" is no longer purely SH+AW. The live count you see at CSFloat DB has shifted to filtering by the SH or AW gold sticker on top, which is why it now reads ~10.9M (a subset that misses every package whose gold sticker has been scraped off). On top of that, the public monthly scan series only covers the first months of each major. After the initial wave the per-month snapshots stopped getting taken, so the months that came after were never recorded as a separate per-map breakdown.
Even with those gaps, the months that were scanned tell a clear story. The breakdown below shows, per map, how many packages were opened in each monthly snapshot in the public dataset. It is the largest dataset publicly available for SH and AW souvenirs:
Stockholm 2021Oct 2021 to Jul 2022 · 10 months10.07M scanned
MonthMirageDust 2AncientInfernoNukeVertigoOverpassMonth total
Oct ’21441k184k148k59k84k51k93k1.06M
Nov ’211.51M750k535k123k182k90k103k3.29M
Dec ’21836k312k148k19k48k47k34k1.44M
Jan ’22625k187k70k9k32k20k10k954k
Feb ’22594k152k66k5k12k35k8k872k
Mar ’22555k172k39k4k16k31k9k825k
Apr ’22359k148k51k2k10k35k5k610k
May ’22242k125k74k8k9k43k2k503k
Jun ’22148k86k20k2k5k16k2k280k
Jul ’22156k39k16k2k3k4k4k224k
Map total5.47M2.16M1.17M233k401k371k270k10.07M
Antwerp 2022May 2022 to Jul 2022 · 3 months3.04M scanned
MonthMirageDust 2AncientInfernoNukeVertigoOverpassMonth total
May ’22668k367k109k144k91k51k46k1.48M
Jun ’22449k191k117k77k70k23k20k948k
Jul ’22352k121k31k41k30k31k9k615k
Map total1.47M680k258k261k191k105k76k3.04M
Cell saturation · log scale
1k10k100k1Mpeak
Per-map monthly opening volume of CS:GO Stockholm 2021 and Antwerp 2022 souvenir packages. Source: monthly CSFloat DB scrapes compiled by [CygaPb] RoadRunner from the CS Market Forum Discord. Numbers are scanned-only and skip the months that were never recorded.
Three things jump out. First, Mirage absolutely dominates: it tops every single row, with totals roughly twice the runner-up Dust 2. Second, the opening curve falls off fast: November 2021 alone (3.29M) is more than the last six months of Stockholm put together. Third, the captured monthly data already adds up to 13.1 million packages opened, which matches the historical CSFloat DB query for SH+AW souvenir skins almost exactly. Few packages have been opened since, so 13M is the floor of the real opened count, not a ceiling.
Now layer in the unopened tail still sitting in inventories four years on, plus a small allowance for packages opened during months that were never scanned, and the realistic SHAW total lands around ~27m souvenir packages at an average of $3 each (Viewer Pass tokens push the price slightly above the $2.99 listed). The remaining ~14M between the scanned 13M and the modeled 27M is mostly unopened tokens still sitting in storage units, plus the slack you would expect from a four-year-old market. So the breakdown looks like this:
~$86mSouvenirs + Pass~27m packages · $3 avg
~$54mCapsules~192m capsules · ~$0.28 avg
Combined Stockholm + Antwerp gross sales$140m
A couple of notes on that bar. The souvenir + Pass count comes from CSFloat DB, but with two corrections layered on top of the live read. First, souvenirs whose gold sticker has been scraped off (some collectors prefer a clean souvenir without the tournament stickers) drop out of CSFloat DB. Second, a small unopened tail still sits in inventories four years on. Both corrections push the realistic total into the mid-twenty-million range. The capsules side, in turn, comes out smaller than people typically expect because most of the budget went to souvenirs, not capsules. Almost every capsule was bought during the recurring 75% off sale at $0.25, so the average price across all capsules sold lands at about $0.28, just above the sale floor.
Step 2 · Stockholm vs Antwerp
Now we split each pool between the two Majors. They did not share evenly. Most capsules went to Antwerp, most souvenirs went to Stockholm, and both pools tilt by similar amounts in opposite directions:
Capsules~192m units · ~$54m · mostly Antwerp
Stockholm 2021~66mcapsules~$17m capsule revenue
Antwerp 2022~126mcapsules~$31m capsule revenue
Souvenirs~27m units · ~$81m · mostly Stockholm
Stockholm 2021~19msouvenirs~$56m souvenir revenue
Antwerp 2022~8msouvenirs~$25m souvenir revenue
The capsule split comes straight from the post-sale Steam Market paper-listings ratio between the two Majors. Antwerp ended its sale with ×1.89 times more papers listed than Stockholm, which is the cleanest cross-major proxy we have for total capsules opened. The souvenir split comes from CSFloat DB applications directly. Both numbers point in the same direction with the same shape.
So why does each pool tilt the way it does? Four structural shifts stack up into this mirror split:
Why Stockholm Sold More Souvenirs and Antwerp Sold More Capsules
1
Two years with no new souvenirs
The previous Major was Berlin, September 2019. The 2020 RMR event still sold sticker capsules (NAVI alone reported around a million dollars from them) so the capsule side stayed alive. But souvenir packages can only drop during a Major, and there was no Major for two full years. By October 2021 the souvenir hunger was massive, while the capsule appetite had already been fed.
2
Stockholm launched three brand-new map collections
Operation Riptide (September 21, 2021) brought in four new map collections: 2021 Dust 2, 2021 Mirage, 2021 Vertigo, and 2021 Train. Three of those four shipped inside Stockholm souvenir packages a month later, with brand-new weapon skins that existed nowhere else and could only be pulled in souvenir quality from Stockholm. The 2021 Train Collection was the only Riptide collection left out of the souvenir lineup, since Train was not in the Major map pool. That alone added a layer of demand on top of the two-year backlog.
3
Antwerp shipped no new souvenir collections
Antwerp's seven souvenir packages drew from the exact same seven collections Stockholm had used: the three Riptide debuts (Dust 2, Mirage, Vertigo) plus the four older collections that already existed back then (Ancient, Inferno, Nuke, Overpass). The freshness premium was burnt the moment Stockholm's sale ended. The autograph capsules, on the other hand, were brand new with new players and new teams, so Antwerp tilted the other way: more capsules, fewer souvenirs.
4
Antwerp had a longer sale window
Sticker capsules from Antwerp stayed on shelves for the full sale cycle, recurring 75% off Major sales included. That extends the tail of capsule purchases well past the event itself.
Putting the two steps together: Antwerp lands at roughly ~126m capsules in total. The next section cross-checks that figure against post-sale Steam Market data across nine Majors, and Section 4 stress-tests it against the $140m budget.
Section 2 lands on a 1 to ×1.89 split between Stockholm and Antwerp. That split, and the Antwerp total it produces, deserve an independent confirmation. Steam Market post-sale paper listings give us exactly that. We compare them against the two Majors with publicly known total supply: RMR 2020 and Paris 2023.
Why Papers, Not Capsules
An earlier version of this section used capsule listings to compare Majors. They turn out to flatten the supply differences badly: Antwerp and Paris show up roughly equal on capsule listings (1,451k vs 1,420k) even though Paris shipped five times more capsules than Antwerp. The reason is more subtle than "capsules are bought to be opened". Plenty of capsules are bought as long-term holds, especially by the bigger investors. The issue is that most retail unboxers open theirs, while the bulk of stockpile-style buyers do not list, and once a capsule sale ends a heavy share of the visible listings comes from people offloading leftovers from short-term flipping, not from anything tied to the original supply. Paris shipped massive supply, but a lot of it sat in unopened bulk inventories and never made it to the listings page.
Papers behave the opposite way. They are the most common drop, almost always treated as low-value by the unboxer, and listed at the floor price pretty much immediately. So listing volume scales with capsules opened, not with leftover demand, and the cross-major paper ratios keep the supply gaps intact. The chart below puts every Major on the same scale, with Paris 2023 set to 100% so the gap is impossible to miss:
Total post-sale paper-tier sticker listings on Steam Market · all team and autograph capsule papers combined · measured at the end of each Major's sticker sale
025%50%75%100%
RMR 2020 anchor
528k
Stockholm 2021
112k
Antwerp 2022 our target
211k
Rio 2022
104k
Paris 2023 validation
1,764k
Copenhagen 2024
257k
Shanghai 2024
94k
Austin 2025
51k
Budapest 2025
167k
Source: post-sale SCM paper listings snapshot, March 2026, compiled by [CygaPb] RoadRunner from the CS Market Forum Discord. Bars normalized so Paris 2023 = 100%.
The RMR Anchor and the Paris Validation
We need two majors with publicly known supply to make this method honest. RMR 2020 is the anchor: the supply is known from leaked team revenue figures (Astralis publicly reported $1m of capsule revenue from RMR, NaVi confirmed similar figures, and Lewis the analyst gathered enough team-level disclosures to put the total at ~250m capsules). RMR also predates Storage Units, so every paper that dropped had to be either applied or listed.
Once we have a single anchored ratio, we still need to know that the relationship holds for other majors. That is where Paris 2023 comes in: it is the second major with a public revenue figure ($110m to teams, $220m total Valve gross via the HLTV leak), so we can plug it into the same equation and check the answer comes back close. If RMR-papers / RMR-supply matches Paris-papers / Paris-supply, the ratio works for the rest of the majors. If not, the method is broken. The rest of the supply numbers in the table fall out of that ratio.
So we have a hard ratio: 528k papers per 250m capsules ≈ 2.1 papers listed per thousand capsules opened. Apply that ratio to every other major and the implied total supply matches the framework analysts have been building for years on the forums:
MajorPapers listedImplied supplyvs RMR
RMR 2020 anchor
~250m×1.0
Stockholm 2021
~66m×0.21
Antwerp 2022 our target
~126m×0.40
Rio 2022
~49m×0.20
Paris 2023 validation
~675m×3.34
Copenhagen 2024
~122m×0.49
Shanghai 2024
~45m×0.18
Austin 2025
~24m×0.10
Budapest 2025
~79m×0.32
Paris 2023 closes the loop on the validation. Plug Paris into the same equation and you get 2.6 papers per thousand capsules, about 25% more than RMR. The gap is clean and easy to explain: Storage Units take in a slice of the post-2021 paper supply that RMR did not have to deal with. RMR sits at the lower end of the range, which gives the more conservative supply estimates downstream.
The Direct AW vs SH Comparison
Comparing Antwerp directly to Stockholm is the cleanest read because both Majors share almost every structural detail: same generation of storage units, same regional market constraints, same audience, same currency exchange windows. Whatever bias affects the listings count affects both rows the same way:
Stockholm 2021112k~66m capsules
Antwerp 2022211k~126m capsules
Antwerp papers ÷ Stockholm papers×1.89
Confirmation
Both methods point to the same answer. The budget math from Valve's $140m disclosure (Section 2) and the paper-listings ratio across Majors (this section) both give a Stockholm to Antwerp split of 1 to ×1.89, and put the Antwerp total at ~126m capsules. Section 4 stress-tests that figure against the budget, and Section 5 splits it across the seven Antwerp capsules.
Stockholm and Antwerp combined sold $140m worth of items. That number is fixed. So whatever the supply numbers are, when you multiply each capsule and each souvenir by its average price, the total has to land at $140m. That is the budget.
Here is what a "fits the budget" check looks like with the realistic ~126m Antwerp estimate that both Section 2's budget math and Section 3's listings ratio agree on. Every $1 in the bar below maps to the same number of pixels:
Realistic case · Antwerp at ~126m capsules
Souv + Pass~$86m
SH caps~$17m
AW caps~$31m
$140m budget
Total $134m in souvenirs and capsules · the remaining ~$6m sits in patch packs and rounding
Souvenirs and the Viewer Pass take more than half the budget. The capsule side splits roughly 1:2 between Stockholm and Antwerp, in line with the paper-listings ratio. The bar fills almost the full budget; the small gap to the right is rounding plus a few patch packs.
Do the same exercise but pretend Antwerp shipped 250m capsules instead of 126m. That would push Antwerp capsule revenue from ~$31m to ~$70m at the average $0.28 sale price. Stockholm cannot drop too far either, because the listings ratio and the souvenir math bound it from below. Watch what happens. The dashed line marks where the $140m budget ends:
Hypothetical · Antwerp at 250m capsules
Souv + Pass~$86m
SH~$17m
AW caps~$37m
AW over+$33m
$140m budget
Total $173m · $33m more than Valve actually collected
That is what "the math collapses" looks like. The dashed budget line cuts cleanly between AW caps and AW over: everything to the right of it (~$33m of capsule revenue) does not exist anywhere in Valve's disclosure.
There is no honest way to fit 250m Antwerp capsules plus the rest of the items into the $140m budget:
Souvenirs would have to nearly disappear, but CSFloat DB still has 13M registered openings on record (and that count is a floor, with unopened tokens still sitting in inventories on top of it).
The average capsule price would have to drop unrealistically low, well under the $0.25 sale floor.
Stockholm would have to be near zero, contradicted by its own paper and capsule listings.
None of those work. The same reasoning runs in the other direction: if Antwerp had been much smaller than 126m, the capsule revenue would not fill enough of the budget to leave room for the souvenirs and the Stockholm share we know existed.
The Stress Test
One last way to see this clearly. Hold souvenirs and Stockholm at their realistic estimates. Vary Antwerp from very small to very big. Read what each row implies for the total:
Antwerp supplyAW caps revenueSouvenirs + SH + PassTotalVerdict
80m~$22m~$103m~$125m$15m short
100m~$28m~$103m~$131m$9m short
126m~$35m~$103m~$140m
fits exactly
150m~$42m~$103m~$145m$5m over
200m~$56m~$103m~$159m$19m over
250m~$70m~$103m~$173m$33m over · impossible
Only one row balances. That is why the Antwerp estimate lands where it does. The $70m teams payout is not just a single data point. It is also a budget that boxes the entire model in from above and from below.
Sections 2 to 4 land on a single number: ~126 million Antwerp 2022 capsules in total. Antwerp did not ship one capsule though, it shipped seven. Each one has a different role, a different sticker pool, and a different drop rate ladder. To count rox holos, we first have to identify the exact capsule they come from.
How the 126m Splits Across the Seven
The 126m total comes out of the budget math (Section 2) and the cross-major paper-listings ratio (Section 3). The per-capsule split is worked out a different way. We use live sticker application data on CSFloat DB, anchored by the public drop rates and the constraint that the seven numbers have to sum back to ~126m.
For every capsule, we count how many stickers from each of its rarity tiers have actually been applied on weapons. Then we divide by the drop rate and correct for the rough share of stickers that get pulled but never applied. That gives the supply each capsule must have had for CSFloat DB's numbers to make sense:
applied stickers÷ drop rate× pulled-vs-applied correction→capsule supply
Repeated for each tier of each capsule, then averaged. Tiers with more applications give tighter estimates.
Three constraints have to hold at once: every capsule's per-tier estimates have to land in roughly the same range, the seven numbers have to sum to ~126m, and the relative ordering has to match what we know about how each capsule was priced and marketed. The split below is the only set of numbers that hits all three at the same time.
Why the Numbers Sit Where They Do
The split is not arbitrary. The ordering tracks structural reasons:
Team capsules outsold autograph capsules on average. The team logos appeal to a wider audience than individual players, and the team capsule is bought as the gateway to the souvenir-eligible team finish more often than for the rare auto drop.
Legends capsules outsold Contenders or Challengers. Legends contain top-seeded teams and players (NaVi, FaZe, G2 etc.), which gets the most casual interest. Contenders has the lowest-seeded entries, which is why Auto Contenders sits near the bottom of the table, even though that is the capsule we care about.
Auto Champions is the smallest. It contains autographs from the FaZe roster only, the Major champions, and was sold as a one-off post-tournament item.
So when we put the seven calibrated numbers in order, this is what comes out. The capsule that matters is highlighted:
CapsuleEstimated supplyUnitsShare
Team Legends team stickers
~29m23%
Auto Challengers player autographs
~23m18%
Team Challengers team stickers
~18m14%
Team Contenders team stickers
~17m13%
Auto Legends player autographs
~17m13%
Auto Contenders rox holo source
~12m9.2%
Auto Champions FaZe autographs
~10m8%
Total Antwerp 2022 capsules~126m100%
The capsule that matters sits near the bottom: Auto Contenders, ~12 million units. It is one of the smaller cards in the deck, just 9.2% of the Antwerp total. Every rox (Holo) sticker in existence came from one of those capsules. Now we need to know how often a capsule actually drops one.
The Drop Rate Ladder
The Auto Contenders capsule contains 25 player autographs in four finishes: Paper, Glitter, Holo, Gold. Each finish belongs to a rarity tier with its own drop rate, sourced from the public capsule rarity table on csgoskins.gg and cs2roi.com:
Paper High1×1 in 1.2580.13%
Glitter Remarkable5×1 in 6.2416.03%
Holo Exoticour tier25×1 in 31.23.21%
Gold Extraordinary125×1 in 1560.64%
The "rarity scale" column is log-scaled relative to Paper. Each chip's width drops with the order of magnitude: Paper at 1×, Glitter 5× rarer, Holo 25× rarer, Gold 125× rarer. Linear bars would make Holo and Gold disappear entirely.
Each row shows the chance of pulling any sticker in that tier from a single Auto Contenders capsule.
From "Any Holo" to "Specifically rox Holo"
The 1-in-31 number is the chance of pulling any Holo sticker from the tier. Inside the Holo tier sits one slot for each of the players in the capsule, and the tier randomly picks one. csgoskins.gg's published per-player chance is 1 in 40 for any specific player Holo within the tier (one slot per player plus a few decorative variants split the same draw). So the chance of pulling rox specifically works out to:
That number looks tiny because it is. On average it takes 1,248 capsules to produce one rox (Holo). To get a sense of scale, here is the same odds expressed three different ways:
1/1,248per capsule
0.0801%probability
~1,248capsules to expect one
Closing the Loop: The Supply Ceiling
Two numbers fully define the rox (Holo) ceiling. Capsules ever produced, multiplied by the chance each one drops a rox holo:
12mcapsules×1/1,248=~9,225
absolute rox (Holo) supply ceiling
That is every rox (Holo) sticker that can ever exist. Not "currently". Not "so far". Every single one, period. Once the last Auto Contenders capsule on Steam is opened, no more rox holos can ever be produced. The supply is hard-capped at around 9,200 stickers, set in stone by the original Antwerp 2022 capsule run.
The next two sections look at how many of those 9,200 have already surfaced, how many are still locked inside unopened capsules, and how the supply is split between applied and unapplied stickers.
Sources
Capsule rarity table: csgoskins.gg and cs2roi.com. Per-player rox (Holo) drop chance independently calculated by csgoskins.gg's drop chance tool. Capsule supply estimates derived from the budget math in Section 2 and the listings ratio in Section 3, calibrated against application volumes.
Section 5 gave us the ceiling: ~9,225 rox holos can ever exist. That figure is the maximum, assuming every Auto Contenders capsule eventually gets opened. The number that has actually surfaced is smaller, and the number applied to weapons is smaller still. This section measures both.
What CSFloat DB Has Recorded
Every hour, ROX CULT scrapes CSFloat DB for new rox (Holo) sticker applications. Latest snapshot:
5,564rox holos appliedCSFloat DB · 15 May 2026
9,225theoretical ceilingif every Auto Contenders capsule is opened
~91%of ceiling reachedalready pulled from capsules
Why the CSFloat DB Number Is Almost Right
The 5,564 figure is good but not perfect. There are owners with private inventories, accounts with no scan history, and a long tail of stickers applied right after release that never hit the Steam Market. Old supply estimates used to apply a generous "miss rate" of 50% on top of the CSFloat DB number to account for all of that. The realistic correction today is much smaller, thanks to one number we measure directly.
Inside the Craft Insights panel on the dashboard, there is a counter for the total number of historical ownership transfers across every known rox-stickered weapon:
20,982Total tradesacross every rox craft CSFloat DB has ever seen
~9.0avg trades per craftover the lifetime of each weapon
The 9-trades number is specific to rox crafts, not a generic Steam stat. rox (Holo) trades for $130 to $200 most of the time, and a craft built around it typically lives on a $200 to $20,000 weapon. The combination is high-value enough that owners list, trade, gift, sell, and re-buy these items constantly. Every transfer is a chance for CSFloat DB to scan the item:
pulled
1scanned
2scanned
3scanned
4scanned
5scanned
6scanned
7scanned
8scanned
9private
today
An average rox craft passes through nine different accounts. Even if the current owner runs a private profile, the craft was almost certainly scanned at one of the previous eight transfers. Once ROX CULT records that scan, the craft stays in our archive permanently, even after it later leaves CSFloat.
This is why the 9-trades figure works for rox specifically and not for, say, a $0.05 paper sticker. Cheap crafts trade rarely, sit in inventories for years, and may never appear on the Steam Market. That is where a 50% miss rate makes sense. For rox holo, given this trade volume and price tag, the realistic miss rate is closer to 5%:
5,564 applied CSFloat DB× 1.05 miss correction→~5,842 applied (real)
A correction of 5% rather than the historical 50%, anchored on the directly-measured 9 trades per craft.
Applied Versus Unapplied
Once a rox holo comes out of a capsule it lives in one of two states. Either it has been applied to a weapon (permanent, CSFloat DB sees it), or it sits unapplied across one of four buckets: Steam Market listings, third-party marketplace listings, raw inventory, or a Steam storage unit. We model the unapplied share at ~30% of total pulled stickers, which gives:
Total rox (Holo) stickers pulled from capsules
~5,842applied to weapons70%
~2,500unapplied30%
Total pulled~8,346
The 8,346 total is what we treat as "rox holos that have surfaced so far". Out of the 9,225 ceiling, that leaves roughly ~879 still locked inside unopened capsules. Most of the supply has already left the box, but a meaningful tail remains.
Where the Unapplied Sit
The 30% unapplied (~2,500 stickers) is where most of the uncertainty lives. Direct measurements only give us partial visibility:
~17 active listings on the Steam Community Market as of 15 May 2026, counting raw stickers and Sticker Slabs. Steam Market is the only place where anyone can buy without a third-party account.
~111 active listings cross-marketplace, per the csdb.gg aggregate across Steam plus CSFloat, Buff163, Skinport, CS.MONEY, DMarket and the rest. That is the visible supply any collector can find for sale at the time of writing.
Low single-digit weekly sales on Steam Market for the raw sticker and slab variants combined. The market clears that volume before new listings show up.
Sticker Slabs launched in November 2025 and absorb a chunk of the unapplied pool by design. Slabbing a rox holo is a way to display it without committing to a weapon. Some slabs are listed (already inside the 111 number), others sit in inventories.
Putting those measurements against the 2,500 estimate, here is where the unapplied stickers actually live as of the latest snapshot:
~2,500 unapplied rox holos · by location
Steam Market listings~170.7%
Third-party marketplaces~943.7%
Held but not listed (inventories, storage units, slabs)~2,38995.6%
Listed for sale at the time of writing: ~111 across all marketplaces · The vast majority sits in inventories, storage units and slabs we cannot scan from the outside.
The 4.4% list rate is normal for a high-value collectible that most owners hold as an investment rather than active inventory. The long tail of "held but not listed" is the largest single bucket and the hardest one to count. Storage units in particular are completely invisible from the outside, even on public profiles, so a rox holo placed inside one is effectively hidden until the owner takes it out.
Working assumption
Treat this as the least certain number in the model. The unapplied share could realistically sit anywhere between 20% and 35%, and the rox holo ceiling and Auto Contenders open count move with it. The model tightens with every revision as more application data comes in.
The next section turns these numbers into the final answer the page started with: how many rox holos will ever exist, when supply runs out, and what that means for the people holding one today.
Sections 1 through 6 carved out the inputs. This one closes the loop. We work the chain backwards from 5,564 applied stickers on CSFloat DB all the way back to capsules consumed and rox holos still locked away.
The Whole Chain in One View
Before unwinding the math step by step, here is the full funnel from Valve's $140 million disclosure all the way down to the rox holos applied today. Each step shrinks the number by an order of magnitude or more:
$140mValve disclosure · SH + AW combined
subtract souvenirs & pass
~192mtotal SH + AW capsules ever sold
×0.65 to AW share
~126mAntwerp 2022 capsules
×9.2% are Auto Contenders
~12mAuto Contenders capsules rox source
×1/1,248 rox holo odds
~9,225absolute rox holo ceiling
share applied so far
5,564rox holos applied today
From $140m to 5,564 stickers in five conversion steps. Each step is documented in detail in the sections above.
Working Backwards: From Applied to Capsules Opened
Three multiplications. Each one inverts a factor we already calibrated:
1
CSFloat DB miss correction5,564 × 1.05 = ~5,842 applied (real)+5% to account for the small share of crafts that never appeared in any of their nine ownership transfers.
2
Applied / pulled ratio~5,842 ÷ 0.70 = ~8,346 pulled70% of pulled stickers end up applied. The other 30% sits in inventories, listings, slabs, and storage units.
3
Capsules per rox holo~8,346 × 1,248 = ~10.42m Auto Contenders openedEach rox holo costs an average of 1,248 capsules of trying, per the per-player drop rate from Section 5.
Out of the ~12 million Auto Contenders we estimated in Section 5, the math says about ~10.42 million have been opened. That leaves a small remaining pool:
Auto Contenders capsules · opened vs unopened
~10.42mopened~91%
~1,100kleft
Of an estimated ~11.5m total Auto Contenders supply
The Three Headline Answers
The page started with three questions in the eyebrow. Time to answer them straight up:
How many rox (Holo) stickers exist?
~9,225
absolute supply ceiling once every Auto Contenders is opened
How many are left to ever come out?
~879
still locked inside the ~1,102k unopened Auto Contenders
When does supply run out?
2 to 6 yrs
runway for the unapplied stack at current ~30 to 100 applications a month
The Application Curve
The shape of the rox holo application curve is the visual proof of a supply that is running out. A small first wave of crafting at $0.99 right after release in May 2022, then heavy crafting through the summer once the capsule went on sale at $0.25 (when the 75% off discount started in September 2022 and stuck), a steady decline as the pool drained, and small bumps each time the price spiked:
Monthly rox (Holo) applications · May 2022 to today
May 2022releaseSummer 2022peak ~640 / monthNow~30 to 100 / month
The Capsule Price Tells the Same Story
If the supply estimate were wrong and there were plenty of capsules left, the Auto Contenders price would be flat. It is not. Capsule price has been climbing through 2025 and 2026, with the supply curve catching up to demand. People still want to crack rox holos (the sticker still trades north of $130) and there are fewer capsules left to crack:
Honest uncertainties, so the math does not pretend to be cleaner than it is:
The $140m figure is rounded. Valve said "over $70m" to teams, which could be $71m or $75m. Does not move things much in either direction.
The souvenir total (~27m units, $3 average) is grossed up from the CSFloat DB openings and still has a small error bar from the unopened tail. A 20% shift here would move the Antwerp capsule supply by ±10m.
The applied/pulled ratio of 70% is the least certain number in the model. Direct measurements only see ~17 listings on Steam Market and ~111 across all marketplaces; the long tail of stickers held in private inventories and storage units is hard to count. Realistic range is 20% to 35% unapplied.
The Auto Contenders supply at ~12m has ±1.5m uncertainty. The split between the seven capsules comes from the same dataset, so a shift in one moves the others.
Drop rates published by csgoskins.gg are calculated from observed unboxings, not from first-party Valve data. They are internally consistent and match cs2roi's independent calculation, but not officially audited.
The conclusion holds even if all of those move at once. Whether the rox holo ceiling sits a thousand stickers higher or lower than 9,200, whether 91% or 85% of the supply is already opened, the direction is the same: the capsule is draining and the pace of new applications is slowing. That does not mean new crafts are finished. Around ~2,500 rox holos are already pulled but sit unapplied in inventories, and roughly ~900 more are still inside unopened capsules. Because a craft needs only one rox, that pool could in principle match or even exceed the crafts that exist today. The realistic number is lower, a few hundred up to perhaps a thousand more, because a pricier sticker gets held more than it gets applied. The total is finite and slowing, but it is far from done.
Reading the Stone
You should now be able to look at the chalkboard at the top of this page and read it like regular text. The Stockholm and Antwerp blocks split the $140m. The seven Antwerp capsules add up to roughly ~126m units. Auto Contenders sits at ~12m, and rox lives inside it at one in 1,248 odds. Paris on the right adds a sanity check at a much bigger scale. The little spelling slips were never the point.
The data behind this page will keep getting refined. As CSFloat DB adds new applications, as the unopened capsule pool slowly drains, as Cologne 2026 changes the way Major capsules even work, the numbers above will move slightly. The page stays live and updates as new evidence comes in. The estimates will tighten, never loosen.
The Antwerp supply framework on this page was built collectively over years of analysis on the CS Market Forum Discord. Salad69 (also known as johnny.69) deserves special credit. He drove most of the back-and-forth that landed on the budget split, the souvenir-share correction, the per-capsule distribution, and the cross-major paper-listings ratio. The model on this page would not exist in this shape without his work, and the many discussions he had with other regulars in the channel.
Data collection
The monthly souvenir-opening data behind the heatmap in Section 2, the CSFloat DB scrapes, and the post-sale paper-listings snapshots in Section 3 come from [CygaPb] RoadRunner, who has kept the data collection running for years.
Wider acknowledgement
Many other members of the same Discord, too many to list, contributed pieces of the picture, including key whale disclosures, capsule-tier observations, sale-window measurements, and pricing-history checks. They have my thanks even where I could not credit them by name.
See the live numbers
The rox (Holo) application count updates every hour. Capsule prices, period breakdown, full history are on the dashboard.